Age of Empires 2: Definitive Edition (AoE) is a remake of the classic 1999 real-time strategy game (RTS), and my number one time sink. I have played over 410 ranked games since its release in November 2019, and with each of my games averaging 33 minutes each I have spent roughly 225 hours trying to get one up over my opponents.
You’d think after spending so much time playing this game, I’d be good at it, right? Thankfully AoE assigns all players using an Elo rating, which goes up and down with their wins and losses, so we can have a very definitive answer to that question. I’ve written up a more detailed explanation of the Elo rating scale at the bottom, for those of you desperate to know.
Given the average rating of an Elo is usually 1,000, my team game rating of 1586 sounds pretty impressive! Unfortunately, the rating scale was stuffed up for team ratings until very recently, which means that I am only in the top 45% of players, rather than the top 5% of players. This is about as close average as it gets, but if I wanted to improve I thought it might be worthwhile to see what civilisations (civs) play to my strengths and which ones play to my weaknesses. Using the excellent API provided by AoE2.net, I have compiled my results across all 410 online ranked games.
The more games I have played with a civilisation, the more my results regress to the mean. However, some of the civilisations considered to be strong at my rating, notably archer civilisations such as the Mayans and the Ethiopians show low win-rates - and I’d rather not talk about my experience playing the Vietnamese.
I have grouped up the civilisations by the most common unit type that I use while playing them. This wasn’t a science, I just eye-balled each civ - so your mileage may vary. For example, I counted the Khmer in both the Siege and Cavalry categories. I have uploaded the CSV that maps each civ to a category to my GitHub for those who may disagree or want to assign it differently.
It was not a surprise to learn that archer civilisations are my main weakness. Because archers are squishy, the fact that I don’t use control groups to allow me to switch between my economy and my military quickly means that I lose more archers than I should. Cavalry, on the other hand, does not punish a set and forget attitude so mercilessly; they usually have a high enough HP and armour rating to withstand a minute or two of neglect.
While I knew that I was bad with Archers, I must admit to being a little surprised to find out that I can single-handedly bring the chances of the entire team (usually of 3 or 4) down by 8 percentage points before the game has even started.
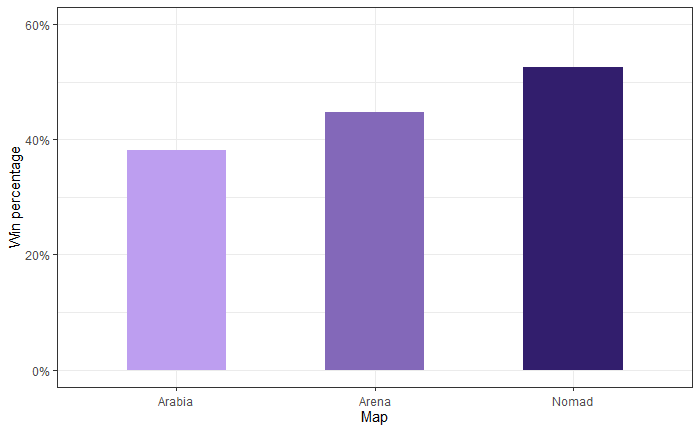
I also wanted to know what type of map I am most successful and to my surprise, Nomad was one of the highest and Arabia one of the lowest. Frankly I’m not sure what to make of it.
If anyone would like to examine their own shortcomings rather than my own (or the shortcomings of my code), the tool can be found at here.
All the things that were too wordy or irrelevant to go into the body text:
Elo explained
The Elo rating is defined based on a players chance of winning:
Given this measure, every player with a 100 rating advantage over the other has a 64% chance of winning, while a player with a 200 rating advantage will win 76% of the time. This is true at every rating level from 300 to 2500. Taking into account the outcome after each match, each players Elo is adjusted to reflect :
1000 is ordinarily taken as the average rating. As mentioned earlier, the rating scale was stuffed up for team ratings until the most recent patch which caused inflation in the team game rating. Spirit of the Law’s explanation of this is better than mine, and I encourage you to give it a watch.
The Overperformance index
But I wanted to take this just a little further - the simple win rate will tend towards my overperformance in the long run, but the samples above are relatively small - about 11 games on average per civilisation. Using the average Elo for each team, I can calculate an ‘Overperformance Index’ which measures how well I performed against each team.
The Overperformance Index is calculated by taking the expected win probability for each game from the average win-rate for each civilisation.
The results of this largely reflected the win rate for each civ (with the exception of the Berbers, who I have played few games with). Take a look at your own results and see how it measures up. There may be life in this metric yet, but it did not provide additional information in my case.
Other charts
(These two are really just the first chart broken out into bars, but I thought they looked nice)


